PlotGlass is a javascript and WebGl library I wrote for plotting realtime data at usable frame rates, with many plots on one page. It gets around webGL context limits in browsers by using only one full screen webGl context. PlotGlass tracks page scrolling and size, then draws only what’s visible for each plot in the page.
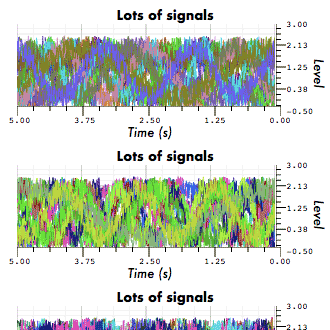
Back in 2013, I was doing something that probably shouldn’t have been done in a browser. In one tab, I was displaying streaming data from up to 200 sensors in 50 different time series plots. For each series I’d either need to keep around 10,000 values, or simplify the historic data.
The various SVG and Canvas based libraries available at the time worked great for about 1% of the data which needed to be displayed. In my case, they all required too much memory overhead and computation time for modifying series data.
I wrote a webGl-based plotting library which used a fixed size, circular vertex buffer to store sensor values. Data was passed using a binary websocket payload, and stuffed into the buffer using a bufferSubData call.
For my use-case, recent data was more important than complete data. To prevent the server from backing up the websocket queue with old data, an acknowledgment was sent from the client for each payload, once all data had been displayed.
However, for each plot, I was creating a new webGl context over the plot body. Depending on the environment and browser version, a single browser tab was typically limited to less than 16 webGl contexts.
My solution was to display a single webGL context over the entire visible screen, and track visible portions of each plot as the page resized or scrolled. Before drawing each plot, I would set the viewport, and scissor the visible region.
This ended up working well, and I’ve rewritten this concept in the project PlotGlass. The current version demonstrates TimeSeries plots, with JSON websocket data only.
If anyone has a similar use-case, and needs a plotting library like this, please let me know and I can work with you to add missing features.


